Learn
Coagulation

TEG & ROTEM

A whole-blood picture of clot formation over time: how fast it starts, how fast it builds, how strong it gets, and whether it breaks down.

How it works

A pin hangs in a heated, oscillating cup of whole blood. As clot forms, it couples the pin to the cup — the trace widens with clot strength.

Figure: Thromboelastography mechanics — Jan Hartmann, Matthew Murphy and Joao D. Dias, CC BY 4.0, via Wikimedia Commons. Converted to WebP.

Read the trace left to right: initiation → clot building → maximum strength → breakdown. First identify the platform, cartridge/assay and sample time.

The labeled trace

R (reaction time) → K and α angle (clot kinetics) → MA (maximum amplitude) → A30 / LY30 (lysis 30 minutes after MA).

Figure: Thromboelastography parameters — Mikael Häggström, MD, CC0 1.0, via Wikimedia Commons. Resized and converted to WebP.

PhaseTEGROTEMMostly reflectsIf abnormal, the team discusses…
InitiationR timeCTClotting factors / thrombin generationLong R: factor deficiency or anticoagulant. Heparin? Compare the heparinase channel (TEG CKH / ROTEM HEPTEM) → protamine; otherwise plasma or PCC.
KineticsK, α angleCFT, αFibrin build-up, fibrinogenLong K / low α: fibrinogen → cryoprecipitate or fibrinogen concentrate (confirm with TEG FF / ROTEM FIBTEM).
StrengthMAMCFPlatelets (≈ 80%) + fibrinogenLow MA with normal fibrinogen: platelets (± DDAVP).
LysisLY30LI30 / MLFibrinolysisHigh LY30: hyperfibrinolysis → tranexamic acid per pathway.

Pattern gallery

Decide what each trace suggests, then reveal. Schematic traces (CC0) — not to scale.

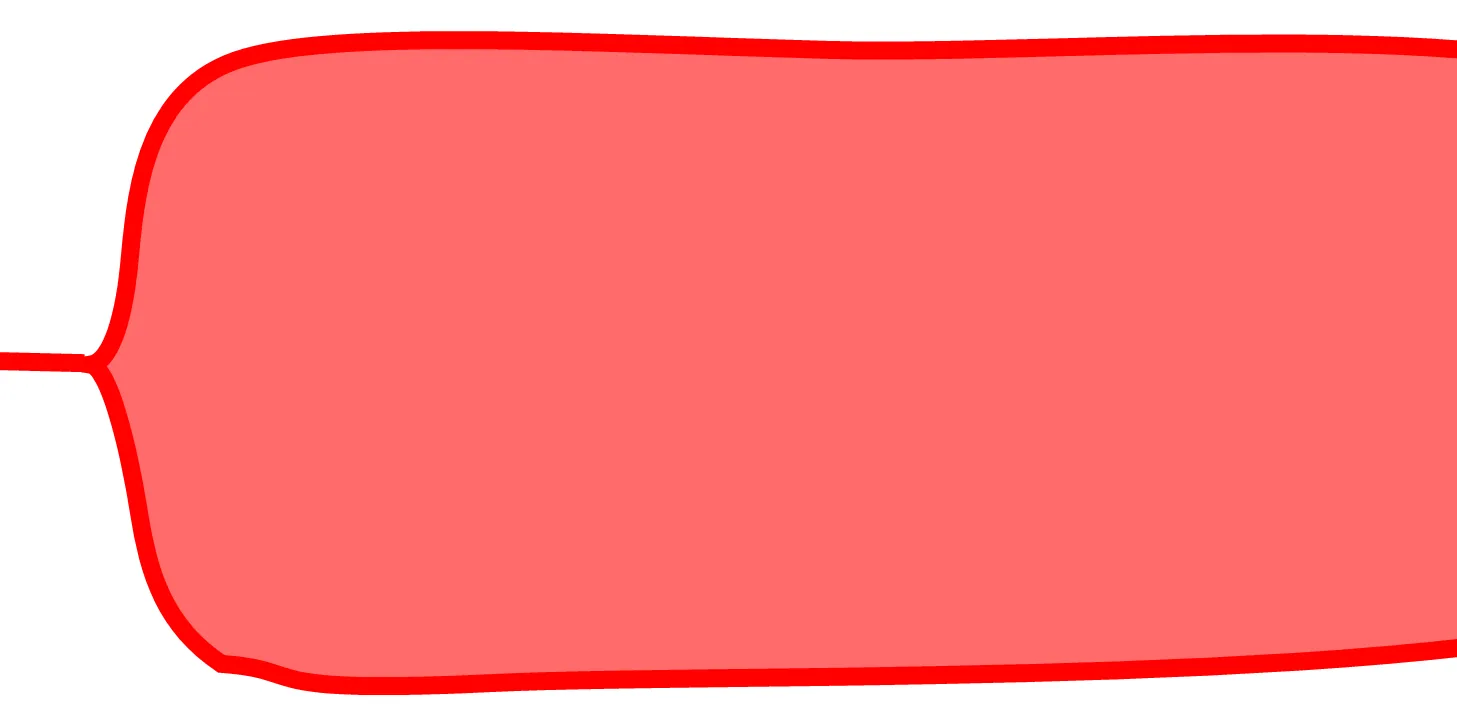
TEG tracing with normal timing but a reduced maximum amplitude, consistent with low or dysfunctional platelets.

Figure: Thromboelastography in low or dysfunctional platelets — Mikael Häggström, MD, CC0 1.0, via Wikimedia Commons.

1. Low MA, normal timing

TEG tracing with a shallow alpha angle and slowly widening, narrow trace, consistent with fibrinogen deficiency.

Figure: Thromboelastography in fibrinogen deficiency — Mikael Häggström, MD, CC0 1.0, via Wikimedia Commons.

2. Shallow α angle, slow build, narrow trace

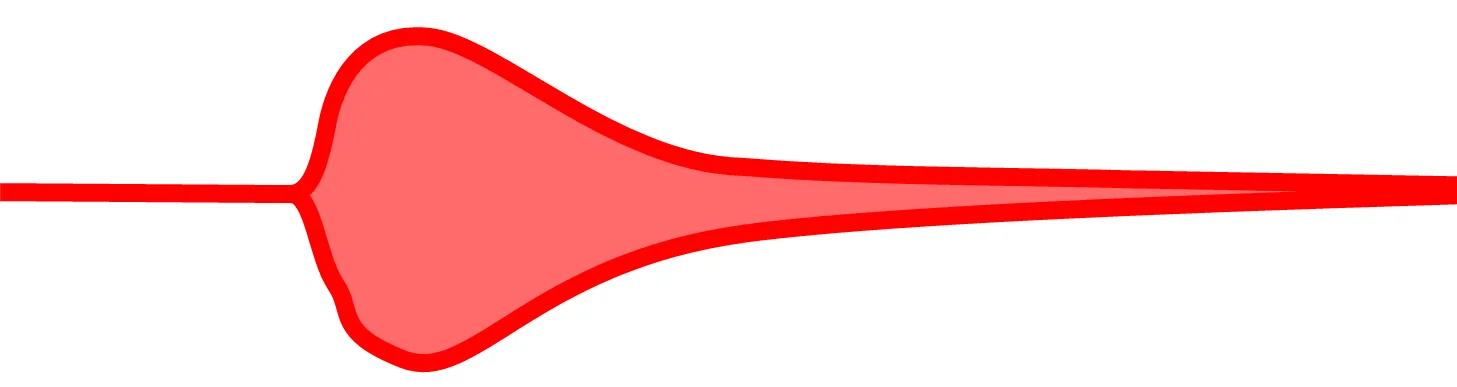
TEG tracing that widens briefly and then rapidly narrows to a thin line, consistent with primary hyperfibrinolysis.

Figure: Thromboelastography in primary fibrinolysis — Mikael Häggström, MD, CC0 1.0, via Wikimedia Commons.

3. Trace builds, then collapses early

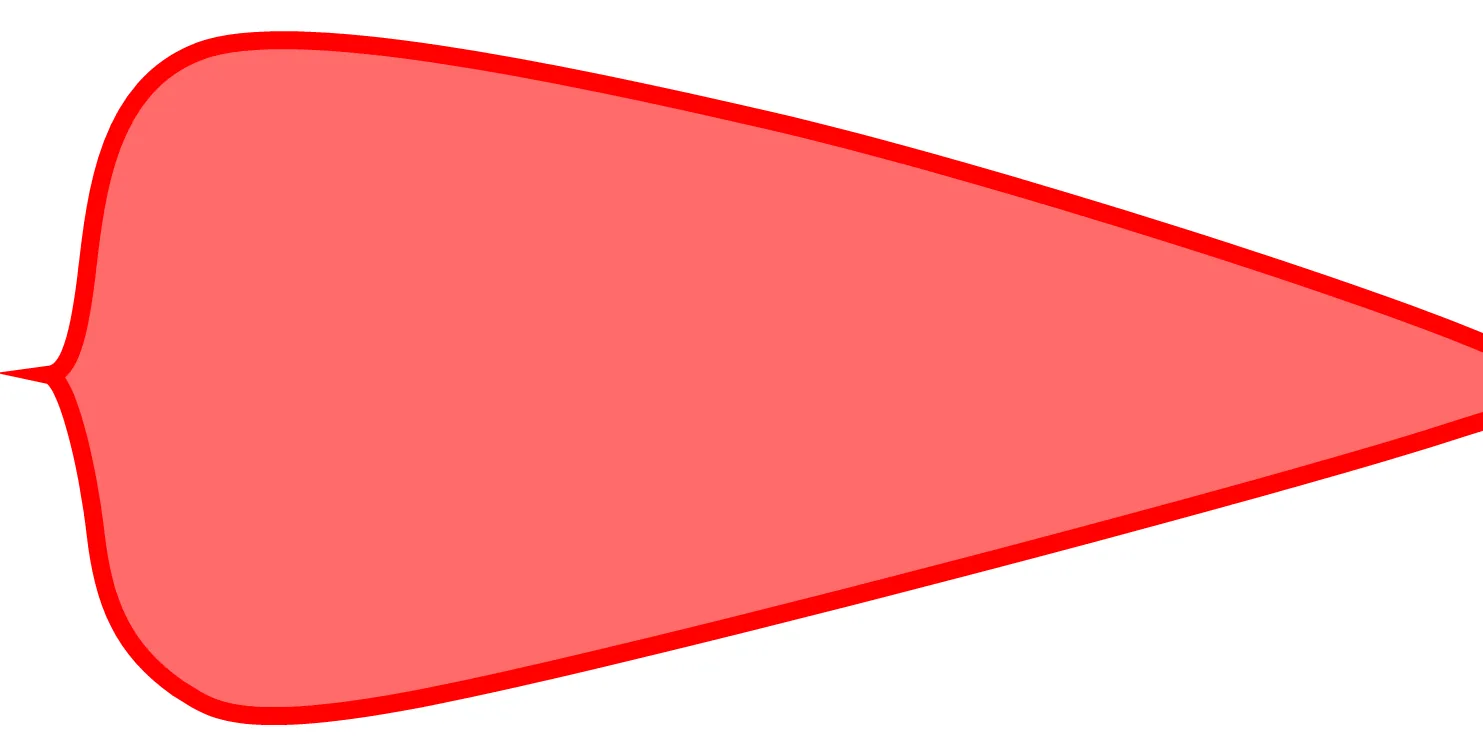
TEG tracing with a short R time and large amplitude that then tapers to a point, consistent with secondary fibrinolysis (as in DIC).

Figure: Thromboelastography in secondary fibrinolysis — Mikael Häggström, MD, CC0 1.0, via Wikimedia Commons.

4. Fast, strong clot that then tapers

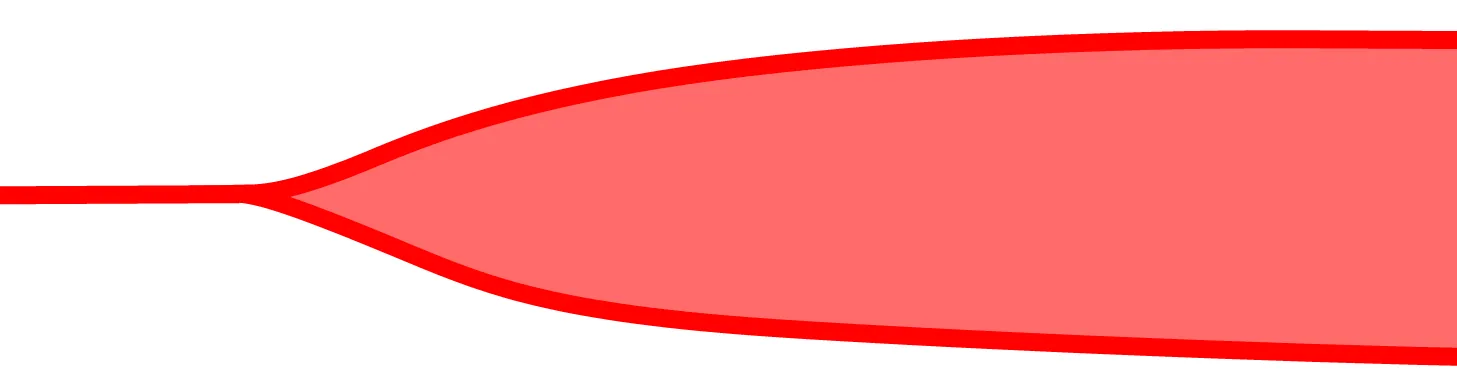
TEG tracing with a short R time, steep alpha angle and very large maximum amplitude, consistent with a hypercoagulable state.

Figure: Thromboelastography in thrombosis — Mikael Häggström, MD, CC0 1.0, via Wikimedia Commons.

5. Short R, steep α, very high MA

Read this trace — quick quiz

Limitations

Pimp questions

Pimp question 1
Which TEG parameter mostly reflects platelets?
Answer
MA (maximum amplitude) — about 80% platelet contribution, the rest fibrinogen.
Pimp question 2
A long R time in a cardiac surgery patient — what do you compare it with?
Answer
The heparinase channel. If it normalizes there, residual heparin is the cause (protamine), not factor deficiency.
Pimp question 3
Can you carry a numeric lysis value from TEG to ROTEM?
Answer
No — the platforms define and time their lysis indices differently.
Offline — showing saved pages